Analytical chemistry
Analytical chemistry is the science of obtaining, processing, and communicating information about the composition and structure of matter. In other words, it is the art and science of determining what matter is and how much of it exists. In 2012 (salary survey data), analytical chemistry was the most popular field of work for ACS chemists.
Analytical chemists use their knowledge of chemistry, instrumentation, computers, and statistics to solve problems in almost all areas of chemistry and for all kinds of industries. For example, their measurements are used to assure the safety and quality of food, pharmaceuticals, and water; to assure compliance with environmental and other regulations; to support the legal process; to help physicians diagnose diseases; and to provide measurements and documentation essential to trade and commerce. Analytical chemists often work in service-related jobs and are employed in industry, academia, and government. They conduct basic laboratory research; perform process and product development; design instruments used in analytical analysis; teach; and work in marketing and law. Analytical chemistry can be a challenging profession that makes significant contributions to many fields of science.
Stand-off remote Raman
Stand-off remote Raman. In standoff Raman, the sample is measured at a distance from the Raman spectrometer, usually by using a telescope for light collection. Remote Raman spectroscopy was proposed in the 1960s[60] and initially developed for the measurement of atmospheric gases.[61] The technique was extended In 1992 by Angel et al. for standoff Raman detection of hazardous inorganic and organic compounds. Standoff Raman detection offers a fast-Raman mode of analyzing large areas such as a football field in minutes. A pulsed laser source and gated detector allow Raman spectra measurements in the daylight[63] and reduces the long-lived fluorescent background generated by transition ions and rare earth ions. Another way to avoid fluorescence, first demonstrated by Sandy Asher in 1984, is to use a UV laser probe beam. At wavelengths of 260 nm, there is effectively no fluorescence interference and the UV signal is inherently strong. A 10X beam expander mounted in front of the laser allows focusing of the beam and a telescope is directly coupled through the camera lens for signal collection. With the system's time-gating capability it is possible to measure remote Raman of your distant target and the atmosphere between the laser and target.
Wikipedia
Vibrational Spectroscopy
Vibrational spectroscopy is concerned with the transitions due to absorption or emission of electromagnetic radiation. These transitions appear in the range of 102 to 104 cm−1 and originate from the vibration of nuclei constituting the molecules. A chemical bond in a molecule can vibrate in many ways, and each vibration is called vibrational mode. There are two types of molecular vibrations, stretching and bending. A stretching vibration is characterized by movement along the bond axis with increasing or decreasing of the interatomic distances, whereas a bending vibration consists of a change in bond angles with respect to the remainder of the molecule. The two widely used spectroscopic techniques based on vibrational energy are the Raman spectroscopy and the infrared spectroscopy. Both methods give complementary information and are based on the fact that within any molecules the atoms vibrate with a few definite sharply defined frequency characteristics of that molecule. When a sample is eradiated to a beam of incident radiation, it absorbs energy at frequencies characteristic to that of the frequency of the vibration of chemical bonds present in the molecules. This absorption of energy by vibrating chemical bond results in an Infrared spectrum. Raman spectroscopy is a scattering phenomenon, and arises due to the difference between the incident and scattered radiation frequencies. It utilizes scattered light to gain knowledge about molecular vibration, which can provide information regarding the structure, symmetry, electronic environment, and bonding of the molecule.
https://www.sciencedirect.com/science/article/pii/B9780444633590000069
The increasing demand for product quality improvement and production rationalization in the chemical, petrochemical, polymer, pharmaceutical, cosmetic, food, and agricultural industries has induced a significant renaissance of the vibrational spectroscopic techniques of Raman, infrared (IR), and near-infrared (NIR) spectroscopy. This trend has partly led to the gradual substitution of time consuming conservative analytical techniques (gas chromatography (GC), high-performance liquid chromatography (HPLC), nuclear magnetic resonance (NMR), and mass spectroscopy (MS)) and nonspecific control procedures (temperature, pressure, pH, and dosing weight) by the more specific and environmentally compatible analytical tools of vibrational spectroscopy. Thus, infrared (IR), NIR, and Raman spectroscopy have emerged over the last decade – in combination with imaging accessories, light-fiber optics, new in-line and on-line probes, and chemometric evaluation procedures – as extremely powerful methods for industrial research, quality control, and process monitoring. Specifically, the NIR wavelength gap between the visible and the IR region, which has over a long period been lying idle, has eventually also been filled with life and is now used according to its real potential.
https://www.sciencedirect.com/science/article/pii/B9780128035818013187
ブルカー(Bruker)
1960年にドイツでGünther Laukienによって設立された。1965年に独立した3チャンネルを備える全半導体式の最初の高分解能核磁気共鳴分光計であるHFX 90を発売した。この製品は欧州とアメリカでの市場で普及して会社の発展の原動力になった。 マサチューセッツ州ビレリカに本社があり、6000人以上の従業員を擁する。核磁気共鳴分光計の代表的な企業で日本国内の大学、研究機関にも多数の納入実績がある。1976年にはMRIを開発した。現在ではM&Aによって分析機器メーカーを傘下に収め、蛍光X線分析装置や赤外・近赤外・ラマンスペクトロスコピー、質量分析計や画像診断装置等を手がける。
主な製品
- 磁気共鳴分光計
- X線回折
- 元素分析
- 赤外・近赤外・ラマンスペクトロスコピー
- 質量分析
- CBRNE検知
- 表面分析
- 前臨床用イメージング
Wikipedia
株式会社堀場製作所(HORIBA)
株式会社堀場製作所(ほりばせいさくしょ 英名:HORIBA, Ltd.)は、京都府京都市南区に本社を置く独立系の分析・計測機器大手。設立以来、分析・計測機器の総合メーカーとして、多彩な製品を世界各国に送りだしてきた。その分野は、自動車や半導体産業をはじめ新素材、エネルギー、鉄鋼、食品、バイオ、化学等々多岐にわたる。最近では、地球温暖化ガス分析装置や酸性雨測定装置など、環境保全に貢献する製品も、多数活躍している。 M&Aを積極的に行い企業価値向上に努めている。社是は「おもしろおかしく」。エンジン排ガス測定・分析装置分野で80%の世界トップシェアを握る。
1945年(昭和20年)10月 - 堀場雅夫が京都市下京区で「堀場無線研究所」を創業。
2015年(平成27年)9月 - フォルクスワーゲンの排出ガス規制不正問題を発見した研究所が使用したポータブル測定機が堀場製作所が製造した製品である事が報道されて一時的に株価が上昇した
製品カテゴリ
- 自動車計測機器
- 環境用計測機器
- 医用計測機器
- 半導体用計測機器
- 科学計測機器
取扱製品
- 自動車排ガス測定装置
- 煙道排ガス測定装置
- pHメータ
- 水質チェッカ
- 大気汚染監視装置
- 蛍光X線検査装置
- ラマン分光測定装置
- 自動血球計数装置
- 放射温度計
- 超薄膜計測システム
- 半導体異物検査装置
- 液晶品位検査装置
Wikipedia
島津(Shimadzu)
株式会社島津製作所(しまづせいさくしょ、英: Shimadzu Corporation)は、京都府京都市中京区に本社を置く、精密機器、計測器、医療機器、航空機器を製造する企業である。
事業内容
- 分析・計測機器
- クロマトグラフ、光吸収分析装置、組成・表面分析装置、液体クロマトグラフ、ガスクロマトグラフ質量分析計、物性評価機器、非破壊検査機器、環境測定機器、電子天秤などを製造している。
- 医用機器
- デジタルX線システム、PET システム、CT スキャナ システム、超音波診断 システムなどの医用画像診断機器を幅広く提供している。
- 産業機器
- 半導体の製造装置をはじめ、液送機器、油圧機器などの各種産業機器を製造している。また、携帯電話やパソコンのキーデバイス製造に欠かせない成膜装置やターボ分子ポンプ(turbo molecule pump)をはじめ、半導体や液晶パネルなどの品質管理を支える検査機器なども製造している。
- 航空機器
- エア・マネジメント・システム、フライト・コントロール・システム、コックピット・ディスプレイ・システム、エンジン始動システム用機器、電子制御装置などを製造している。また、油圧・空気・燃料系用の各種航空機搭載機器の機能試験装置、 航空医学訓練装置などの地上支援機器も製造している。なお、ヘッドアップディスプレイ(HUD)の国内シェアは1位である。
Wikipedia
Mass spectrometer analysis
Mass spectrometer analysis is used in detection and identification of chemical structure of given unknown mixture. It provides precise quantitative analysis and technique to detect the ultra-trace levels.
The spectrometer works in following steps
- Ionization: Ionization process takes place by knocking one or more electrons off to give a positive ion as mass spectrometers always work with cations.
- Acceleration: All cation gets accelerated to make them same as kinetic energy.
- Deflection: Cation gets deflected in magnetic field which depends upon their mass. Less mass correspond to less deflection. Deflection also depends on the positive ion given, as more charge is responsible for more deflection.
- Detection: The beam of ions detected by using electrical detector.

Mass spectra contains several sets of peaks which corresponds to the molecular ion, isotope peak, fragmentation peaks and metastable peaks. Out of these peaks the molecular ion peak is mostly visible and can be weak or missing. The molecular ion is a cation (M+) formed by removing one electron from the molecule.
The relative intensity of the molecular ion peak decreases with branching and with molecular mass in a homologous series. For example in mass spectra of toluene the molecular ion peak is located at 92 m/z same as the molecular mass of toluene and preceded by a M-1 or M-2 peak.
The peak with the highest intensity is called the base peak which is not necessarily the molecular ion. Other peaks are larger than the molecular ion peak because of isotope distributions and known as isotope peaks.
attomole
10e-18 of a mole
ionization
ionization methods:
- Electron Impact Ionization
- Chemical Ionization
- Field Ionization
- Fast Atom Bombardment
- Matrix-Assisted Laser Desorption Ionization
- Electrospray Ionization
- Atmospheric Pressure Chemical Ionization
m/z
The mass-to-charge ratio (m/Q) is a physical quantity that is most widely used in the electrodynamics of charged particles, e.g. in electron optics and ion optics. It appears in the scientific fields of electron microscopy, cathode ray tubes, accelerator physics, nuclear physics, Auger electron spectroscopy, cosmology and mass spectrometry.[1] The importance of the mass-to-charge ratio, according to classical electrodynamics, is that two particles with the same mass-to-charge ratio move in the same path in a vacuum when subjected to the same electric and magnetic fields. Its SI units are kg/C. In rare occasions the thomson has been used as its unit in the field of mass spectrometry.
cation
A positively charged ion. Opposed to anion.
psi, bar, torr, pascal
Psi = Pound per square inch
1 Psi = 0.0689475729 Bar = 6 894.75729 pascals
1 Bar = 100 kilopascals.
It is very close to the atmospheric pressure (atm) which is the pressure at the sea level (1 atm equals to 101.325 kilopascals).
1 Torr = 1/760 of a standard atmosphere = 133.3 Pa
Pascal is a SI derived unit of pressure.
1 Pa = 1 newton per square metre
Gas chromatography (GC)
Gas chromatography (GC) is a common type of chromatography used in analytical chemistry for separating and analyzing compounds that can be vaporized without decomposition. Typical uses of GC include testing the purity of a particular substance, or separating the different components of a mixture (the relative amounts of such components can also be determined). In some situations, GC may help in identifying a compound. In preparative chromatography, GC can be used to prepare pure compounds from a mixture.
In gas chromatography, the mobile phase (or "moving phase") is a carrier gas, usually an inert gas such as helium or an unreactive gas such as nitrogen. Helium remains the most commonly used carrier gas in about 90% of instruments although hydrogen is preferred for improved separations. The stationary phase is a microscopic layer of liquid or polymer on an inert solid support, inside a piece of glass or metal tubing called a column (an homage to the fractionating column used in distillation). The instrument used to perform gas chromatography is called a gas chromatograph (or "aerograph", "gas separator").
The gaseous compounds being analyzed interact with the walls of the column, which is coated with a stationary phase. This causes each compound to elute at a different time, known as the retention time of the compound. The comparison of retention times is what gives GC its analytical usefulness.

Programmable Temperature Vaporizer (PTV), Flame Ionization Detector (FID), Electron Capture Detector (ECD)
MALDI
In mass spectrometry, matrix-assisted laser desorption/ionization (MALDI) is an ionization technique that uses a laser energy absorbing matrix to create ions from large molecules with minimal fragmentation.[1] It has been applied to the analysis of biomolecules (biopolymers such as DNA, proteins, peptides and sugars) and large organic molecules (such as polymers, dendrimers and other macromolecules), which tend to be fragile and fragment when ionized by more conventional ionization methods. It is similar in character to electrospray ionization (ESI) in that both techniques are relatively soft (low fragmentation) ways of obtaining ions of large molecules in the gas phase, though MALDI typically produces far fewer multiply charged ions.
MALDI methodology is a three-step process. First, the sample is mixed with a suitable matrix material and applied to a metal plate. Second, a pulsed laser irradiates the sample, triggering ablation and desorption of the sample and matrix material. Finally, the analyte molecules are ionized by being protonated or deprotonated in the hot plume of ablated gases, and can then be accelerated into whichever mass spectrometer is used to analyse them.
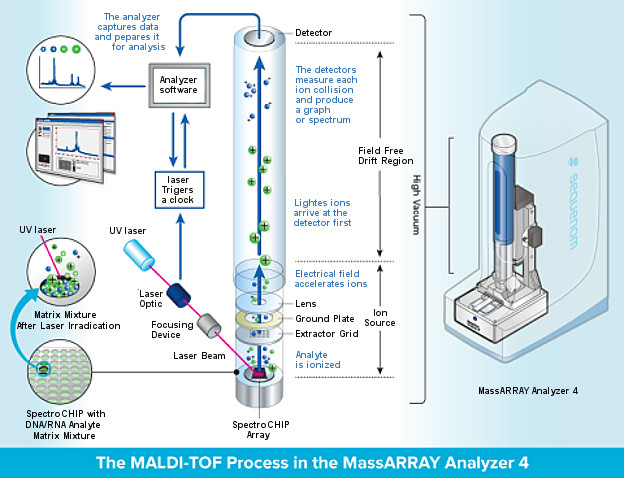
Matrix assisted laser desorption/ionization (MALDI)
By incorporating the (bio)molecules in a large excess of
matrix molecules, strong intermolecular forces are
reduced. The matrix molecules absorb the energy from the
laser light and transfer it into excitation energy of the solid
system. The effect is an instantaneous phase transition of
small molecular layers of the sample into a gaseous state.
Thus solid (and liquid) material can be easily analyzed by
TOF MS.
MALDI uses a nitrogen UV laser (337 nm) to generate ions from high mass,
non-volatile samples such as peptides and proteins. The key to
this technique, which was discovered several years ago, is that
in the presence of an energy absorbing matrix like α-cyano-4-
hydroxy cinnamic acid (CHCA), large molecules like peptides
ionize instead of decomposing.
In this technique, purified or
partially purified proteins are mixed with a crystal-forming
matrix, placed on an inert metal target, and subjected to a
pulsed laser beam to produce gas phase ions that traverse a
field-free flight tube and then are separated according to their
mass/charge ratio (m/z).
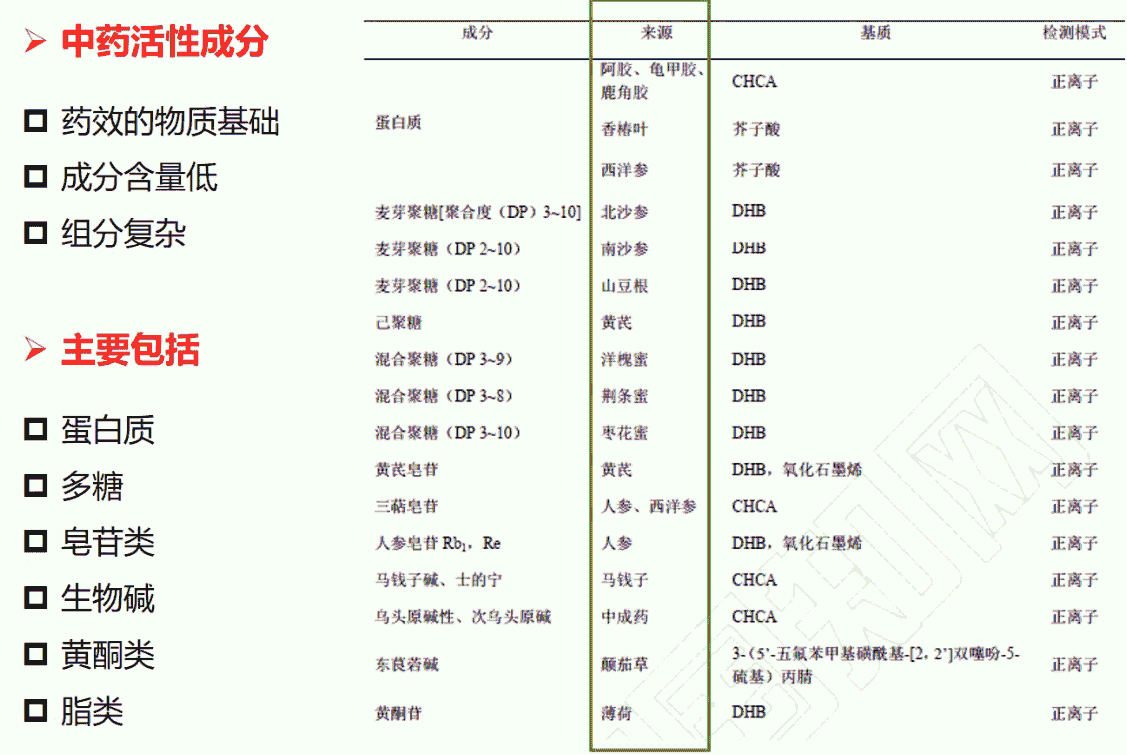
MALDI-MS for herbs
TOF (time-of-flight)
The type of a mass spectrometer most widely used with MALDI is the TOF (time-of-flight mass spectrometer), mainly due to its large mass range. The TOF measurement procedure is also ideally suited to the MALDI ionization process since the pulsed laser takes individual 'shots' rather than working in continuous operation. MALDI-TOF instrument or reflectron is equipped with an "ion mirror" that reflects ions using an electric field, thereby doubling the ion flight path and increasing the resolution.
MALDI-TOP (Matrix Assisted Laser Desorption/Ionization Time-Of-Flight)
In the MALDI-TOF process, the sample to be analyzed is mixed with another compound, called a matrix. The mixture is applied to a target slide, placed inside the instrument, and irradiated with a laser. The matrix absorbs the laser light and vaporizes, along with the sample, in the process gaining an electrical charge (ionization).
Electric fields then guide the ions into the flight tube, which separates them according to ‘weight’ (mass) and displays the results as a series of lines (spectrum) which correspond to different fragments that have broken away from the original molecule. By analyzing the pattern of fragments it is possible to deduce the structure of the molecule.
Finally, compare the sample spectrum to an extensive database of spectra from bacterial species to allow the system to accurately identify the microorganism in question.
M4i22 8 bit Digitizer
High-performance liquid chromatography (HPLC; formerly referred to as high-pressure liquid chromatography)
High performance liquid chromatography is basically a highly improved form of column chromatography. Instead of a solvent being allowed to drip through a column under gravity, it is forced through under high pressures of up to 400 atmospheres. That makes it much faster.
Scheme

Retention time
The time taken for a particular compound to travel through the column to the detector is known as its retention time. This time is measured from the time at which the sample is injected to the point at which the display shows a maximum peak height for that compound.
Different compounds have different retention times. For a particular compound, the retention time will vary depending on:
- the pressure used (because that affects the flow rate of the solvent)
- the nature of the stationary phase (not only what material it is made of, but also particle size)
- the exact composition of the solvent
- the temperature of the column
That means that conditions have to be carefully controlled if you are using retention times as a way of identifying compounds.
Detector
1)紫外可见吸收检测器(UV-Vis)
UV-Vis检测器是目前HPLC中应用最广泛的检测器,简称紫外检测器。这种检测器灵敏度高,线性范围宽,对流速和温度变化不敏感,可用于梯度洗脱分离。紫外检测器要求被检样品组分在紫外或可见光区有吸收,而使用的流动相无紫外吸收或紫外吸收波长与被检组分紫外吸收波长不同,在被检组分紫外吸收波长处没有吸收。紫外检测器属选择性检测器,同时它是非破坏性检测器,可用于制备色谱。
(2)光电二极管阵列检测器(PAD或DAD)
普通的UV-Vis检测器只能测定某一波长时吸光度与时间关系曲线,即只能作二维图谱。要测定某组分的紫外可见吸收光谱图,需采用“停留扫描”的方法,PAD能够同时测定吸光度、时间、波长三者的关系,通过计算机处理,可以得到三维图谱,也可做出任意波长的吸光度-时间曲线(色谱图)和任意时间的吸光度-波长曲线(紫外可见光谱图)。PAD的一个重要用途是峰纯度检验。
(3)示差折光检测器(RID)
RID也称光折射检测器,是一种通用型检测器。基于连续测定色谱柱流出物光折射率的变化而用于测定溶质浓度。溶液的光折射率是溶剂(流动相)和溶质各自的折射率乘以其物质的浓度之和,溶有样品的流动相和流动相本身之间光折射率之差即表示样品在流动相中的浓度。原则上凡是与流动相光折射率有差别的样品都可用它来测定。其检测限可达10-6 - 10-7g/mL,一般不能用于梯度分析。
(4)蒸发光散射检测器(ELSD)
ELSD是一种质量型检测器,它可以用来检测任何不挥发性化合物,包括氨基酸、脂肪酸、糖类、表面活性剂等,尤其对一些较难分析的样品,如磷脂、皂苷、生物碱、甾族化合物等无紫外吸收或紫外末端吸收的化合物更具有其他HPLC检测器无法比拟的优越性。此外,ELSD对流动相的组成不敏感,可以用于梯度洗脱。ELSD的检测灵敏度要高于低波长紫外检测器和示差折光检测器,检测限可低至于10-10g。
(5)荧光检测器(FLD)
许多化合物,特别是芳香族化合物、生化物质,如有机胺、维生素、激素、酶等被入射的紫外光照射后,能吸收一定波长的光,使原子中的某些电子从基态中的最低振动能级跃迁到较高电子能态的某些振动能级,之后,由于电子在分子中的碰撞,消耗一定的能量而下降到第一电子激发态的最低振动能级,再跃迁回到基态中的某些不同振动能级,同时发射出比原来所吸收的光频率较低、波长较长的光,即荧光。被这些物质吸收的光称为激发光(λex),产生的荧光称为发射光(λem)。荧光的强度与入射光强度、量子效率、样品浓度成正比。FLD的最大优点是的高灵敏度和良好的选择性。一般来说,它比紫外吸收检测器的灵敏度要高10-1000倍,可达mg/L级,而且它所需要的试样很少,因此在药物和生化分析中有着广泛的用途。
(6)电导检测器(CD)
CD是离子色谱中使用最广泛的检测器,其原理是用两个对电极测量水溶液中离子型溶质的电导,由电导的变化测定淋洗液中溶质浓度。这种检测器的死体积小,如采用抑制电导法,其灵敏度可达10-8 g/mL,线性动态范围为103。
(7)安培检测器(AD)
AD采用固体工作电极,电极可用于较高的正电位,故能检测氧化还原性物质,适用范围很宽。AD结构简单,池体积小,响应快,噪声低,灵敏度高。但是由于电极表面容易被污染,需要经常抛光更新。AD有直流、脉冲和积分之分,也是离子色谱常用的检测器之一。
(8)质谱检测器(MSD)
一般是指HPLC-MS或HPLC-MS/MS等联用,通常作为结构测定或化合物鉴定等使用。有极高的灵敏度和分辨率。目前流行的接口是电喷雾离子化(ESI)和大气压化学电离(APCI),并有正负二种离子方式,应用范围极其广泛。
其它HPLC检测器还有:
(9)化学反应检测器
也就是将被检物质进行某种化学反应(衍生反应,酶反应等)后再用高灵敏度的某种检测器检测。如氨基酸分析仪,固相化学反应检测器(固定化酶反应器)等。
(10)介电常数检测器
介电常数检测器是一种通用型检测器,灵敏度低,通用性强。其工作原理是:随流动相中流出组分的改变,其介电常数、电容量也改变,因此测定流动相的电容量变化,即可检测组分的变化。介电常数检测器性能类似于RID,但其应用不如后者普遍。
(11)电位测定检测器
电位测定检测器利用离子选择电极测定流出液的电位,流出液组成改变,电位也发生变化。使用不同的离子选择电极(如卤离子电极,银离子电极等)可测定不同的离子浓度变化情况。
(12)放射性检测器
放射性检测器是一种检测流动相中有放射性标记组分的特殊检测器。其响应范围很宽,对没放射性的流动相成分的改变不敏感,可有效地使用梯度洗脱技术。
(13)光电导检测器
光电导检测器是利用某些化合物受强烈紫外光照射引起光电离形成离子的现象,在电导池中检测。这种检测器对卤代物和许多含硫和氮的光敏化合物有选择性响应。光电导检测器对某些化合物的灵敏度比紫外-可见光吸收检测器还高,两者线性范围相当。
(14)红外光谱检测器
红外检测器可用作HPLC的选择性检测。这种方法主要用于凝胶色谱,且只能用于流动相对所用红外波长没有吸收的体系。目前应用较多的是傅里叶变换红外光谱检测器,即HPLC-FTIR联用,由于扫描速度快,不用停留就可以得到每一个色谱峰的红外光谱图。
(15)库仑阵列电化学检测器
库仑阵列电化学是一种新型的检测器,灵敏度非常高(10-15),用于测定电化学活性物质,可得到三维的色谱图(时间、电势、浓度)。
(16)粘度检测器
粘度检测器主要用于凝胶色谱中测定高分子的相对分子粒
Total ion current (TIC) chromatogram
The total ion current (TIC) chromatogram represents the summed intensity across the entire range of masses being detected at every point in the analysis.[2][3] The range is typically several hundred mass-to-charge units or more. In complex samples, the TIC chromatogram often provides limited information as multiple analytes elute simultaneously, obscuring individual species.
Retention Time
(In chromatography) The amount of time elapsed from the injection of a sample into the chromatographic system to the recording of the peak (band) maximum of the component in the chromatogram.
Peak Deconvolution
“Deconvolution” is a term often applied to the process of decomposing peaks that overlap with each other, thus extracting information about the “hidden peak”.

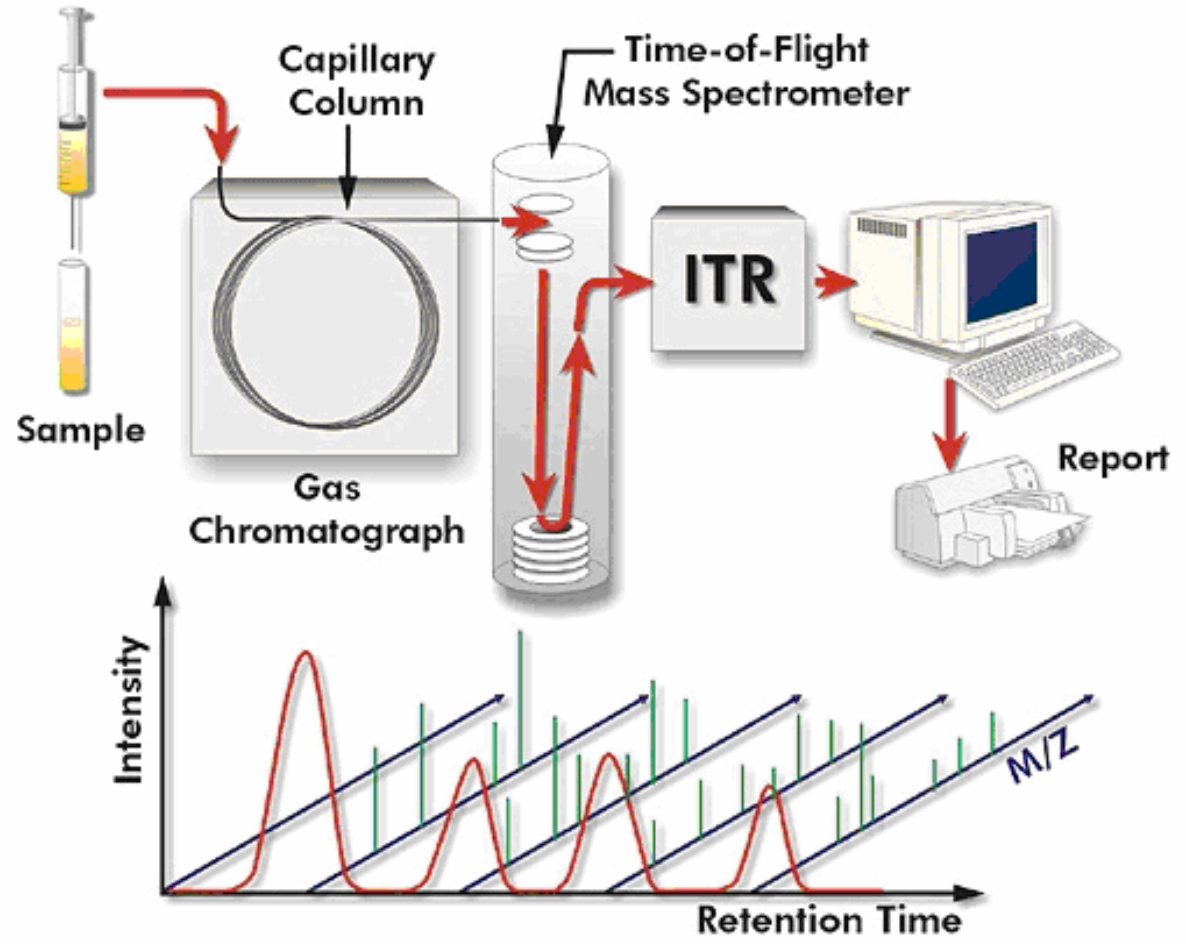
Gas chromatography–mass spectrometry (GC-MS)
Gas chromatography–mass spectrometry (GC-MS) is an analytical method that combines the features of gas-chromatography and mass spectrometry to identify different substances within a test sample.[1] Applications of GC-MS include drug detection, fire investigation, environmental analysis, explosives investigation, and identification of unknown samples, including that of material samples obtained from planet Mars during probe missions as early as the 1970s. GC-MS can also be used in airport security to detect substances in luggage or on human beings. Additionally, it can identify trace elements in materials that were previously thought to have disintegrated beyond identification. Like liquid chromatography–mass spectrometry, it allows analysis and detection even of tiny amounts of a substance.
GC-MS has been regarded as a "gold standard" for forensic substance identification because it is used to perform a 100% specific test, which positively identifies the presence of a particular substance. A nonspecific test merely indicates that any of several in a category of substances is present. Although a nonspecific test could statistically suggest the identity of the substance, this could lead to false positive identification.
The Pegasus HT system combines gas chromatography and mass
spectrometry, two very powerful analytical techniques.
Gas chromatography (GC) is an analytical technique for the separation
of volatile and semi-volatile components in chemical mixtures. Mass
spectrometry (MS) is a universal, specific, and very sensitive detection
technique for measuring the mass and quantity of ions. Mass
spectrometry can provide unambiguous information about the identity
and quantity of individual components in a mixture. Common to all
mass spectrometers are four main operational steps: sample
introduction, ionization in ion source, mass analysis, and ion detection.
There are several types of mass spectrometers available for
conventional GC/MS analysis including quadrupole, ion trap, and
magnetic sector, however, the Pegasus uses a very non-traditional
type of mass spectrometer: a TOF (time-of-flight) mass spectrometer.
A TOF mass spectrometer (TOFMS) offers tremendous benefits for
analysis, most notable are a dramatically reduced analysis time and an
improved quality of the analytical results. This is because the TOFMS
acquires sample information very fast and orders magnitude faster
than other types of mass spectrometers. Combining GC/MS with
TOFMS (GC-TOFMS), the Pegasus can analyze the chemical
composition of volatile and semi-volatile mixtures, providing
quantitative and qualitative information on the individual components
of the mixture.
The National Institute of Standards and Technology (NIST)
Raman spectroscopy
Raman spectroscopy is a spectroscopic technique based on inelastic scattering of monochromatic light, usually from a laser source. Inelastic scattering means that the frequency of photons in monochromatic light changes upon interaction with a sample. Photons of the laser light are absorbed by the sample and then reemitted. Frequency of the reemitted photons is shifted up or down in comparison with original monochromatic frequency, which is called the Raman effect. This shift provides information about vibrational, rotational and other low frequency transitions in molecules. Raman spectroscopy can be used to study solid, liquid and gaseous samples.
在透明介质的散射光谱中,频率与入射光频率υ0相同的成分称为瑞利散射;频率对称分布在υ0两侧的谱线或谱带υ0±υ1即为拉曼光谱,其中频率较小的成分υ0-υ1又称为斯托克斯线,频率较大的成分υ0+υ1又称为反斯托克斯线。靠近瑞利散射线两侧的谱线称为小拉曼光谱;远离瑞利线的两侧出现的谱线称为大拉曼光谱。
Although not yet used as commonly as in other scientific fields, Raman spectroscopy is gaining popularity as an analysis technique in food and beverage applications.
Typically, analytical techniques for food and beverage characterization involve determination of the composition via quantitative methods, quality control (including adulteration, bacterial contamination), and identification of impurities or undesired material. Usually, chromatography (GC, GC-MS, HPLC), is employed for such characterization but might be time-consuming, use solvents and require sample preparation. Additionally, contrary to infrared techniques, Raman spectroscopy is not sensitive to high water content, and is thus well adapted to analyze aqueous solutions.
Reference: Introduction to Raman Spectroscopy
色散型拉曼光谱仪 vs 傅里叶变换光谱仪
In practice - What is the difference between dispersive Raman and FT-Raman?
色散型拉曼光谱仪,是通过光栅分光,并用阵列CCD检测不同波长的光信号,测量过程中,结构是固定的;
傅里叶变换光谱仪,光路方面类似迈克尔逊干涉仪,通过移动其中一面反射镜,来扫描不同波长的共振信息,再经由傅里叶变换,将扫描测得数据,转化为不同波段的信号。
实际使用中,傅立叶变换拉曼可以很好地用于常规分析中,但在日常测量中也存在很多限制:
1. 只能使用1064 nm 近红外激光,带来的缺点是:低灵敏度、不适合测量水溶液、 不适合测量深色样品.
2. 光学设计限制了能够达到的空间分辨率(这也是多数傅立叶变换拉曼光谱仪制造商不使用傅立叶变换拉曼显微镜的原因.
色散型拉曼系统的优势在于在同一台仪器上既可以进行常规的分析,又具有进行科学研究的能力,包括:
1. 多个激光波长:可以根据多种样品的具体情况以及散射性质选择最优化方案,从而实现增强灵敏度、控制穿透深度、抑制荧光等等。例如:
绿光最适宜无机物和共振拉曼(如碳纳米管和其它碳材料)和表面增强拉曼测量。
红色或近红外激光(780-830 nm) 最适宜抑制荧光的产生,通常不差于使用1064 nm近红外激光的傅立叶变换拉曼。
红色或绿色激光适宜水溶液测量。
紫外激光适宜于诸如蛋白质之类生物分子的共振拉曼。
2. 拉曼显微镜 - 真共焦拉曼显微镜 (傅立叶变换拉曼的光学设计不支持使用这种功能) 能够提供大约1微米左右的空间分辨率。使用技术上成熟稳定的真共焦针孔能够提供灵敏的样品拉曼图象, 从而显示样品的化学组成、分布、形态以及很多其他的样品特征。
Main Raman wave numbers, in cm-1, and their respective tentative assignments
| Wavenumber (cm-1) | Raman Shift Interpretation |
|---|---|
| 1748 | C=O伸缩振动,主要可能源自于脂肪有关的酯基 |
| 1663 | C=O伸缩振动和C=C伸缩振动,其中C=O伸缩振动可能主要源自于蛋白质的酰胺I键,C=C伸缩振动主要源自于不饱和脂肪酸 |
| 1465 | CH2变形振动,可能主要源自于糖类和脂肪分子 |
| 1337 | 糖类的C-H变形振动、C-O伸缩振动或/和游离胆固醇的C-C伸缩振动 |
| 1304/1260 | 糖类以及饱和脂肪酸的CH2扭曲振动 |
| 1130 | 饱和脂肪酸的C-C伸缩振动或/和糖类的C-C伸缩振动、C-O伸缩振动以及C-O-H变形振动 |
| 1080 | 游离胆固醇的C-C伸缩振动或/和糖类的C-C伸缩振动、C-O伸缩振动以及C-O-H变形振动 |
| 930 | 胆固醇或/和糖类的C-O-C变形振动、C-O-H变形振动和C-O伸缩振动 |
| 862 | 糖类的C-C-H变形振动和C-O-C变形振动 |
| 777 | C-C-O变形振动 |
| 719 | C-S伸缩振动 |
| 652 | C-C-O变形振动 |
| 591/573 | C-C-C变形振动、C-O扭曲振动 |
| 518 | 葡萄糖 |
| 484/427/363 | C-C-C变形振动、C-O扭曲振动 |
Raman Microscope
One of the greatest benefits is the use of a true CONFOCAL Raman microscope (共聚焦拉曼成像) design. This enables a very small sample area or volume to be analysed – down to the micron scale. Combine this micro Raman analysis with automated focusing, XYZ movement (3D 拉曼成像和深度剖析), and it becomes possible to produce ‘chemical’ images of a sample.
共聚焦拉曼成像
共聚焦拉曼显微方法是高分辨率拉曼成像技术,可广泛用于材料化学成分的表征与分析。固体和液体成分的化学信息可实现衍射受限的空间分辨,即分辨率为激发波长的一半,低至 200 nm。无需任何标记或特殊样品制备技术。拉曼图像可以获得样品内所含的化学化合物及其空间分布信息。
Soft ionization
Formation of gas-phase ions without extensive fragmentation.
由于离子化所需要的能量随分子不同差异很大,因此,对于不同的分子应选择不同的离解方法。通常称能给样品较大能量的电离方法为硬电离方法,而给样品较小能量的电离方法为软电离方法,后一种方法适用于易破裂或易电离的样品。 “软”是相对于最常用的电子电离EI而言。采用软电离技术容易获得能指明相对分子质量的准分子离子(M+H)+、(M-H)+,,但能供结构信息的碎片离子较少。
Surface-enhanced laser desorption/ionization (SELDI)
This method uses protein chip arrays with different selective surfaces such as cation or anion exchange surfaces, hydrophobic surfaces and metal binding surfaces. Biofluids such as cell lysate, plasma or urine are applied onto the selective surface and, after washing, a subset of proteins is specifically bound. The chip is then analyzed in a (MALDI) TOF-MS which generates a protein spectrum of the different molecular masses present on the protein chip. This technology is therefore highly suited for research into molecular mechanisms of disease and biomarker identification
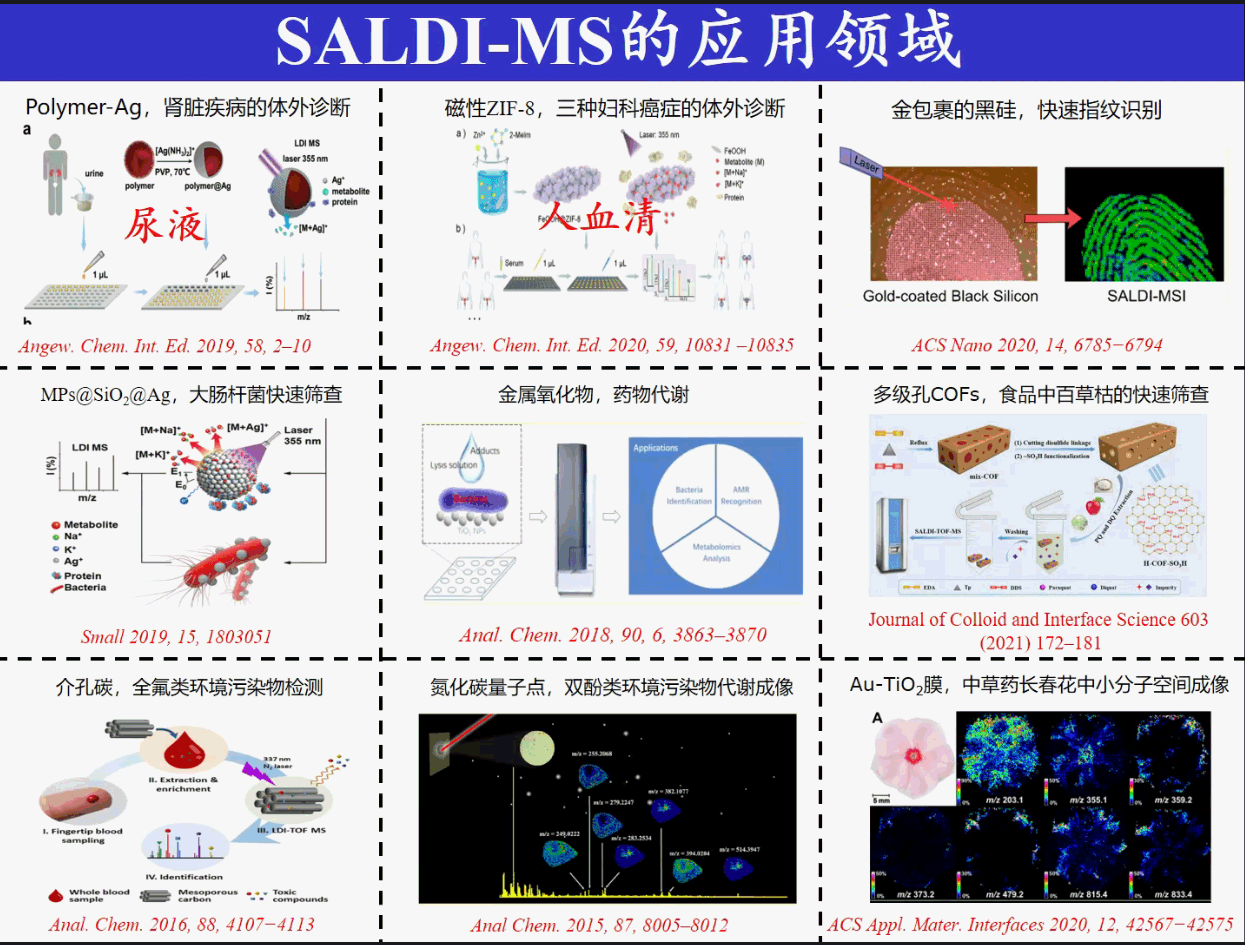
Surface-assisted laser desorption/ionization (SALDI)
Fluorescent X-ray Spectrometry
When irradiating X-rays onto a material, fluorescent X-ray (characteristic X-ray), which has energy (wavelength) unique to the element that composes the material will be generated. When we measure the fluorescent X-ray energy, the contained element is identified (qualitative analysis), and we can calculate the concentration (quantitative analysis) from the intensity of the fluorescent X-ray of each element. Thus, the qualitative or quantitative analyses of a material by irradiating X-rays onto an unknown material and analyzing the fluorescent X-ray that is generated, is called fluorescent X-ray spectrometry.
There are two types of fluorescent X-ray spectrometry; the wavelength dispersive type (WDXRF) using analyzing crystals, and the energy dispersive type (EDXRF) using semiconductor detectors (EDS).
Comparison between Energy Dispersive Type and Wavelength Dispersive Type Spectrometers
The characteristics of a wavelength dispersive type spectrometer (WDXRF) are high sensitivity, high accuracy, high resolution, and high reproducibility. We can expect sensitivity and accuracy at levels one order of magnitude higher than those of the energy dispersive type spectrometer (EDXRF). These characteristics are provided by a high-power X-ray tube (3 to 4 kW) and its cooling device, a goniometer which makes complicated movements and an exchange mechanism for the analyzing crystal and detector and so on. Naturally, the instruments are larger, with a complicated structure and high price. The specimen surface is required to be flat and the available analysis area is from several mm to 30mm or so. This type of device is suitable for process management where specimens with the same form are analyzed one after another.
The characteristics of the energy dispersive type spectrometer (EDXRF) are simple structure and low price, its adaptability to a variety of specimens, and its user-friendliness. The X-ray bulb is compact (several tens W) and air-cooled, and since the EDS (semiconductor detector) itself performs the analysis, a complicated spectroscopy section is not necessary.

Electronic Nose
Electronic nose is an analytical tool composed of an array of sensors (e.g. metal oxide, polymer) responding to volatile compounds with changes in their electrical properties. The combined pattern of these changes from all the sensors forms a fingerprint for the sample.

image source: 10.3390/s16040520
System Architecture
ppt material
- 云平台统一管控
- 设备状态监控
- 任务分配
- 终端设备数据上传
PDO/PGI/TSG - Protected Food Names
- PDO (Protected Designation of Origin) for products with a strong link to the defined geographical area where they are produced
- PGI (Protected Geographical Indication) for agricultural products and foods linked to a geographical area where at least one production step has taken place.
- Traditional Specialities Guaranteed (TSG) emphasise traditional composition and mode of production of products (proven usage on the domestic market for at least 25 years).
酶联免疫吸附测定法 (Enzyme-Linked ImmunoSorbent Assay , ELISA)
双抗体夹心法是检测抗原最常用的方法,操作步骤如下: 一、将特异性抗体与固相载体连接,形成固相抗体:洗涤除去未结合的抗体及杂质。 二、加受检标本:使之与固相抗体接触反应一段时间,让标本中的抗原与固相载体上的抗体结合,形成固相抗原复合物。洗涤除去其他未结合的物质。 三、加酶标抗体:使固相免疫复合物上的抗原与酶标抗体结合。彻底洗涤未结合的酶标抗体。此时固相载体上带有的酶量与标本中受检物质的量正相关。 四、加底物:夹心式复合物中的酶催化底物成为有色产物。根据颜色反应的程度进行该抗原的定性或定量。 根据同样原理,将大分子抗原分别制备固相抗原和酶标抗原结合物,即可用双抗原夹心法测定标本中的抗体。
免疫层析法(immunochromatography assay,ICA)
出现于20世纪80年代初期的一种新型的免疫分析方式,它是在免疫渗滤(immunofiltrationasay,IFA)的基础上建立的一种简单快速的免疫学检测技术。免疫层析法原理是将特异的抗体先固定于硝酸纤维素膜的某一区带,当该干燥的硝酸纤维素一端浸入样品(尿液或血清)后,由于毛细管作用,样品将沿着该膜向前移动。
IMS - Ion Mobility Spectroscopy, 离子迁移谱
Ion-mobility spectrometry (IMS) is an analytical technique used to separate and identify ionized molecules in the gas phase based on their mobility in a carrier buffer gas. Though heavily employed for military or security purposes, such as detecting drugs and explosives, the technique also has many laboratory analytical applications, including the analysis of both small and large biomolecules.[1] IMS instruments are extremely sensitive stand-alone devices, but are often coupled with mass spectrometry, gas chromatography or high-performance liquid chromatography in order to achieve a multi-dimensional separation.
IMS系统的核心部分是迁移管,迁移管分为电离区和迁移区两部分,中间以离子门分隔开。被测样品被加热气化后,由载气带入电离区,载气分子和样品分子在离子源放射性Ni的作用下发生一系列的电离反应和离子-分子反应,形成各种产物离子。在电场的作用下,这些产物离子通过周期性开启的离子门进入迁移区。一方面从电场获得能量作定向漂移, 另一方面与逆向流动的中性迁移气体分子不断碰撞而损失能量,由于这些产物离子的质量, 所带电荷, 碰撞截面和空间构型各不相同, 故在电场中各自迁移速率不同,使得不同的离子到达探测器上的时间不同而得到分离。
SPI-TOF-MS, single photon ionization time-of-flight mass spectrometer, 单光子
单光子电离飞行时间质谱法(SPI-TOF MS)采用真空紫外光作为离子源,可将电离能低于光子能量的样品分子电离,主要得到分子离子,碎片离子很少,谱图简单,易于实现快速、准确的定性和定量分析。
What is a CCD detector?
A CCD (Charge Coupled Device) is a silicon based multichannel array detector of UV, visible and near-infra light. They are used for Raman spectroscopy because they are extremely sensitive to light (and thus suitable for analysis of the inherently weak Raman signal), and allow multichannel operation (which means that the entire Raman spectrum can be detected in a single acquisition). CCDs are widely used, not least as the sensors in digital cameras, but versions for scientific spectroscopy are of a considerably higher grade to give the best possible sensitivity, uniformity and noise characteristics.
CCD detectors are typically one dimensional (linear) or two dimensional (area) arrays of thousands or millions of individual detector elements (also known as pixels). Each element interacts with light to build up a charge – the brighter the light, and/or the longer the interaction, the more charge is registered. At the end of the measurement read out electronics pull the charge from the elements, at which point each individual charge reading is measured.
In a typical Raman spectrometer, the Raman scattered light is dispersed using the diffraction grating, and this dispersed light is then projected onto the long axis of the CCD array. The first element will detect light from the low cm-1 edge of the spectrum, the second element will detect light from the next spectral position, and so on...the last element will detect light from the high cm-1 edge of the spectrum.
CCDs require some degree of cooling to make them suitable for high grade spectroscopy. Typically this is done using either peltier cooling (suitable for temperatures down to -90oC), and liquid nitrogen cryogenic cooling. Most Raman systems use peltier cooled detectors, but for certain specialised applications liquid nitrogen cooled detectors still have advantages.
作物遥感监测
原文:https://zhuanlan.zhihu.com/p/42584871

"对作物遥感监测的原理是建立在作物光谱特征基础之上的,即作物在可见光部分(被叶绿素吸收)有较强的吸收峰,近红外波段(受叶片内部构造影响)有强烈的反射率, 形成突峰,这些敏感波段及其组合形成植被指数,可以反射作物生长的空间信息。 势遥感监测的基础是必须有可用遥感监测的生物学长势因子,以植被指数、 叶面积指数等为代表的植被遥感参数是公认的能够反映作物长势的遥感监测指标。"