SPACS (Spectroscopic Profiling Data Achieving and Communication System)
A prototype information system based on a standardized domain ontology and workflow profile. SPACS links all stakeholders in the food & drug quality and safety management settings.
Background
Food and drug safety and quality has always been a global issue. Both developing and developed countries experienced a series of food scandals and safety events, such as the "2013 Horsemeat Scandal" in Europe, “2008 Melamine Milk Scandal” and the "2018 Vaccine Crisis" in China.
To fight food and drug scandals, modern analytical technologies are used to monitor the data throughout the entire product chain. These technologies include bionic sensors (e.g. e-nose, e-tongue), mass spectrometry and its coupled use (e.g. GC-MS, LC-MS), polymerase chain reaction (PCR), infra-red spectrometry, Raman spectrometry, etc. Among them, the rapid, non-invasive methods, including Raman spectrometry and matrix-assisted laser desorption /ionization time-of-flight (MALDI-TOF) mass spectrometry (MS), have received great attention and are becoming more and more used for the purpose of food and drug quality and safety.
Research
Our team conducts research in three inter-related aspects.
- 1) Propose a domain ontology that is able to represent various spectroscopic profiling data and their related context data. The data format based on the domain ontology should also facilitate the data analysis and reporting process, and it is ideal to be compatible to modern analytical platforms, such python, R, MATLAB, etc.
- 2) Design a spectroscopic profiling data processing workflow profile for general food & drug quality and safety management. This profile gives a formal definition of all participants, their roles and interactions in the real settings. The message specifications and communication APIs are also defined in the profile.
- 3) Implement a prototype information system - SPACS (Spectroscopic Profiling Data Achieving and Communication System), based on the above domain ontology and workflow profile. SPACS links all stakeholders in the food & drug quality and safety management ecosystem.
Demo
This is a demo version of SPACS with several limitations. Visitors can use account "demo" and password "demo" to login.
LoginTerminology
The controlled vocabulary of the system. It contains a formal definition of all entity fields and their allowed values.
TerminologySchema
The database schema is decided by the domain ontology. The relational database schema and creation script are as follows.
SchemaFunding
[1] Natural Science Foundation of China,91746202,2018-2021
[2] Natural Science Foundation of China,61806177,2019-2021
[3] Natural Science Foundation of China,71433006,2015-2019
Publication
[1] Building an Information Infrastructure of Spectroscopic Profiling Data for Food-Drug Quality and Safety Management [J], Enterprise Information Systems, 2019, DOI:10.1080/17517575.2019.1684567
Domain ontology core entities for spectroscopic profiling data.
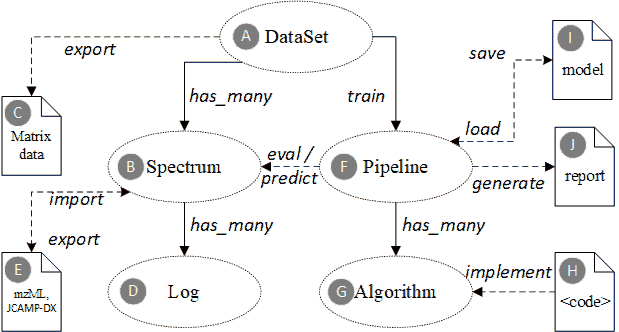
Solid arrow lines indicate concrete foreign-key reference in the underlying database, while dashed lines indicate an external reference, e.g. URL or resource path. Elliptical shapes are entities that will be persisted in the database. The document icons represent external or intermediate file objects.
The domain ontology defines the core entities and their associations.
A.	The “DataSet” is a collection of multiple “Spectrum” instances. The spectrums in one dataset are generated for the same purpose (e.g. classify milk brands or identify a specific genuine geo herb), by the same measurement modality (Raman or MALDI-TOF-MS), with the same data preprocessing methods (i.e. filtering, averaging, peak identification, baseline drift removal, etc.), and must have the same data dimensions (i.e. peak number).
B.	The “Spectrum” is a basic unit to represent a specific spectroscopic data. It is usually a final processed spectrum data (e.g. averaged and filtered from multiple scans) that can be used directly for successive data analysis, other than the original raw data.
A spectrum object contains an array of X values (e.g. wave number for Raman, or m/z for MALDI-TOF-MS), and an optional y label (used for supervised data analysis).
C.	A “DataSet” can be exported as a matrix or tabular form, which is directly importable by major scientific data analysis platforms, such as MATLAB, R, or Python. In the following manuscript, we will show how to use this intermediate data format to drive the data analysis workflow.
D.	Each “Spectrum” instance has multiple “Log” items, which track the status change in its life cycle. The ontology defines several phases for the spectrum data life cycle, including generate, preprocess, curate, analyze and report.
E.	Each “Spectrum” instance can be serialized to an mzML (for MS) or JCAMP-DX (for vibrational spectroscopy) file or deserialized from an external one. For third-party instruments and systems (e.g. Agilent, Bruker, Horiba, Shimadzu, Thermo, Waters, etc.), such standard file formats can be used to exchange and share spectrum data. Our team is also developing our own MALDI-TOF-MS hardware that will directly transmit data in the designed format.
F.	The “Pipeline” is a set of algorithm elements organized to achieve complex data analysis tasks. A typical pipeline for spectroscopic data contains several preprocessors (e.g. filter, normalization, dimension reduction) and one regressor or classifier.
G.	Each “Algorithm” instance represents a specific algorithm component used in the pipelines. The algorithms belong to several categories, such as baseline drift removal, averaging filter, feature scaling, feature selection, classifier, regressor, etc.
H.	Each algorithm can have multiple implementations from different scientific platforms and programming languages. The implementation can be machine-interpretable scripts, source codes or compiled binary files. Engineers can either call existing libraries to implement algorithms or upload their own implementations.
I.	Each “Pipeline” object is targeted to a specific data set and analysis purpose. The final state of a pipeline instance is usually a statistical model (e.g. logistic regression, SVM or neural network) trained by the related data set. The model with its various parameters is persisted to a model file (e.g. .mat file for MATLAB or pickle file for python), and can be reloaded back to runtime.
J.	A trained pipeline can predict/analyze a new sample data of the same topic, and generates both a human-readable report and a computer-processable structured report for further decision support uses.
| Code | Coding System | Concept | Type | Digest | Description |
|---|---|---|---|---|---|
| E0065 | SPACS | DataSet | [Entity] | 2F31A6F | A collection of spectrum data, generated for the same purpose (e.g. classify milk brands or identify a specific genuine geo herb), by the same measurement modality (Raman or MALDI-TOF-MS), with the same data preprocessing methods (i.e. filtering, averaging, peak identification, baseline drift removal, etc.), and manifest the same data dimensions. |
| E0065.A0001 | SPACS | DataSet Id | [Attribute] | 1A65D18 | Unique ID. Primary key. |
| E0065.A0002 | SPACS | DataSet Name | [Attribute] | 1365E92 | Name of the data set |
| E0065.A0003 | SPACS | DataSet InputCode | [Attribute] | 147E57D | Acronym or abbreviation. Used for quick search. |
| E0065.A0004 | SPACS | Test Object | [Attribute] | 36C8E82 | The object under test, where the sample is taken from. E.g. infant milk, horse meat, a specific herb, etc. Use public terminologies to encode the object, such as FOODON, is recommended. |
| E0065.A0005 | SPACS | Test Topic | [Attribute] | 35F8492 | The topic or target of the data set. E.g. classify milk brands or identify a specific genuine geo herb. |
| E0065.A0006 | SPACS | SOP | [Attribute] | 1E03B26 | SOP (Standard Operation Procedures) to prepare the sample and get the spectrum data. SOP should be specific and detailed so that other researchers can reproduce the same result. |
| E0065.A0007 | SPACS | Modality | [Attribute] | 11D3A7F | The test/detection modality. Should be one of the following enumerated values. Can also use HUGO-PSI MS terminology if the modality a kind of MS. |
| E0065.A0007.V0001 | SPACS | Raman | [Value] | 3418DE6 | Raman spectrometry |
| E0065.A0007.V0002 | SPACS | MS | [Value] | 2DBE3ED | Mass spectrometry in a general sense. Equal to MS:1000268 in HUGO-PSI MS. |
| E0065.A0007.V0003 | SPACS | MALDI_TOF_MS | [Value] | 19EF0AB | Matrix-Assisted Laser Desorption /Ionization Time-Of-Flight Mass Spectrometry. Equal to MS:1000075 in HUGO-PSI MS. |
| E0065.A0007.V0004 | SPACS | SELDI_TOF_MS | [Value] | 1872203 | Surface-Enhanced Laser Desorption /Ionization Time-Of-Flight Mass Spectrometry. Equal to MS:1000278 in HUGO-PSI MS. |
| E0065.A0007.V0005 | SPACS | IMS | [Value] | E235DD | Ion Mobility Spectrometry. Equal to MS:1000261 in HUGO-PSI MS. |
| E0065.A0007.V0006 | SPACS | NIRS | [Value] | 229C26A | Near-InfraRed Spectrometry |
| E0065.A0007.V0007 | SPACS | FIRS | [Value] | 13A4063 | Far-InfraRed Spectrometry |
| E0065.A0007.V0008 | SPACS | SPI_MS | [Value] | 14CA74A | Single Photon Ionization Mass Spectroscopy |
| E0065.A0007.V0009 | SPACS | unknown | [Value] | 592BA6 | |
| E0065.A0008 | SPACS | Device | [Attribute] | 4E2F49 | The instrument and client software version that generates this data set. |
| E0065.A0009 | SPACS | FilePath | [Attribute] | EEF38D | A cached (will not re-create if already exists) matrix or tabular file exported from this data set, which can be directly importable by major scientific data analysis platforms, such as MATLAB, R, or Python. |
| E0065.A0010 | SPACS | Spectrums | [Attribute] | 35A1D92 | Navigation property for a collection of Spectrum objects. |
| E0065.A0011 | SPACS | Samples | [Attribute] | 489C81 | Total count of spectrum data samples. |
| E0065.A0012 | SPACS | XLabels | [Attribute] | 32A01CB | The headers or X labels of the data set. A string separated by comma. For example, the XLabels of a Raman spectrum data would be the wave numbers "250, 251, 252 ... , 2338, 2339". For MS, XLabels could be m/z "M/Z 0.019054, 0.019869, 0.020702, 0.021552, 0.022419, 0.023303 ... 303.687942, 303.789856, 303.891787 ... 304.503730, 304.605781, 304.707848". |
| E0065.A0013 | SPACS | YLabels | [Attribute] | 27BDB69 | The Y labels of the data set, used for training supervised learning models. Use a json format. For the liquor year identification, YLabels can be "["5 years","8 years","16 years","26 years"] |
| E0065.A0014 | SPACS | YLabelSamples | [Attribute] | 236201C | The sample count of each Y label. Use a json format. For the liquor year identification, YLabelSamples can be "{"5 years": 30,"8 years": 29, "16 years": 30, "26 years": 27} |
| E0065.A0015 | SPACS | DataSet Timestamp | [Attribute] | 2073DAE | Latest revision timestamp. |
| E0066 | SPACS | Spectrum | [Entity] | 17ED92E | Represent a piece of spectroscopic data, which is usually a final processed state (e.g. averaged and filtered from multiple scans or raw data) and can be used directly for successive data analysis. |
| E0066.A0001 | SPACS | Spectrum Id | [Attribute] | 4ED137 | Uniqure ID. Primary key. |
| E0066.A0002 | SPACS | Spectrum FilePath | [Attribute] | 1969228 | The original mzML (for MS) or JCAMP-DX (for vibrational spectroscopy) file from third-party instruments (e.g. Agilent, Bruker, Horiba, Shimadzu, Thermo, Waters, etc.). Used as a standard file format to import/export spectrum data. |
| E0066.A0003 | SPACS | Spectrum Digest | [Attribute] | DD4C6C | The digital fingerprint or digest of the spectrum data. |
| E0066.A0004 | SPACS | YLabel | [Attribute] | 1141CB3 | The category or Y label of this data. Used for training supervised learning models. |
| E0066.A0005 | SPACS | Sequence | [Attribute] | 1D1B637 | A compressed byte array of the spectrum data. |
| E0066.A0006 | SPACS | Modality | [Attribute] | 2159EF7 | The test/detection modality. Share the same modality enumerations with E0066.A0007. |
| E0066.A0006.V0001 | SPACS | XAxisMeaning | [Value] | 618DFD | The physiochemical meaning of X axis. E.g. for Raman, X axis means wave number. For MS, X axis means m/z or time. |
| E0066.A0007 | SPACS | XAxisUnit | [Attribute] | FBFB9B | X Axis Unit. e.g. cm-1 for Raman. |
| E0066.A0008 | SPACS | Logs | [Attribute] | D773A8 | Navigation property for a collection of Log objects, which tracks the historical status change of the data. |
| E0066.A0009 | SPACS | Spectrum Metadata | [Attribute] | 306B9C7 | Additional metadata. Can be a serialized json or xml object. |
| E0066.A0010 | SPACS | Spectrum Timestamp | [Attribute] | 1F64FA0 | Latest revision timestamp. |
| E0071 | SPACS | Algorithm | [Entity] | 3F86D24 | Represents a specific algorithm component used in the pipelines. The algorithms belong to several categories, such as baseline drift removal, averaging filter, feature scaling, feature selection, classifier, regressor, etc. |
| E0071.A0001 | SPACS | Algorithm Id | [Attribute] | 28FACC | Unique ID. Primary key. |
| E0071.A0002 | SPACS | Algorithm Source | [Attribute] | 26B9DD9 | The source of the algorithm. If the algorithm is self developed, source should be "private". Otherwise, specify the fully qualified module or class name, e.g. "sklearn.manifold.TSNE" |
| E0071.A0003 | SPACS | Algorithm Name | [Attribute] | 1666695 | Name of the algorithm |
| E0071.A0004 | SPACS | Algorithm InputCode | [Attribute] | 300308F | Acronym or abbreviation. Used for quick search. |
| E0071.A0005 | SPACS | Algorithm Category | [Attribute] | 33244E2 | The category of the algorithm. Should be one of the following enumerated values. |
| E0071.A0005.V0001 | SPACS | Preprocessing | [Value] | 3094E6E | |
| E0071.A0005.V0002 | SPACS | Dimension Reduction | [Value] | A2301C | |
| E0071.A0005.V0003 | SPACS | Feature Selection | [Value] | 3E3CD1D | |
| E0071.A0005.V0004 | SPACS | Regression | [Value] | 2CF532A | |
| E0071.A0005.V0005 | SPACS | Classification | [Value] | 9D16C4 | |
| E0071.A0005.V0006 | SPACS | Clustering | [Value] | 29C9174 | |
| E0071.A0005.V0007 | SPACS | Visualization | [Value] | 12920C | |
| E0071.A0006 | SPACS | Algorithm Tag | [Attribute] | 3392EE4 | An additional tag for the algorithm. |
| E0071.A0007 | SPACS | Algorithm Reference | [Attribute] | 2318A1C | Published literature resource for the algorithm. |
| E0071.A0008 | SPACS | Algorithm Url | [Attribute] | 147F7DF | Knowledge base URL. e.g. https://en.wikipedia.org/wiki/{Name} |
| E0071.A0009 | SPACS | Algorithm Description | [Attribute] | 37F969D | A brief description for the algorithm. |
| E0071.A0010 | SPACS | Algorithm Metadata | [Attribute] | 312E94F | Metadata about the algorithm. Can be a serialized json or xml object. |
| E0071.A0011 | SPACS | Algorithm Implementation | [Attribute] | 29383B7 | The programming language or script for algorithm implementation. Should be one of the following enumerated values. |
| E0071.A0011.V0001 | SPACS | Python | [Value] | 2B3589C | |
| E0071.A0011.V0002 | SPACS | C/C++ | [Value] | 3A6BA11 | |
| E0071.A0011.V0003 | SPACS | C# | [Value] | 3969BAD | |
| E0071.A0011.V0004 | SPACS | Javascript | [Value] | 2E726D3 | |
| E0071.A0011.V0005 | SPACS | R | [Value] | 14730EB | |
| E0071.A0011.V0006 | SPACS | Java | [Value] | 2B1A3A6 | |
| E0071.A0011.V0007 | SPACS | Matlab | [Value] | 1E2673D | |
| E0071.A0011.V0008 | SPACS | Octave | [Value] | 35CDEB1 | |
| E0071.A0012 | SPACS | Algorithm Code | [Attribute] | 322860C | Code snippet or pseudo code for the algorithm. |
| E0071.A0013 | SPACS | Algorithm Timestamp | [Attribute] | 2BCC29D | Latest revision timestamp. |
| E0070 | SPACS | Pipeline | [Entity] | 165753F | The “Pipeline” is a set of algorithm elements organized to achieve complex data analysis tasks. A typical pipeline for spectroscopic data contains several preprocessors (e.g. filter, normalization, dimension reduction) and one regressor or classifier. |
| E0070.A0001 | SPACS | Pipeline Id | [Attribute] | 2065E92 | Unique ID. Primary key. |
| E0070.A0002 | SPACS | Pipeline Name | [Attribute] | 97E53F | Name of the pipeline |
| E0070.A0003 | SPACS | Pipeline InputCode | [Attribute] | 13C4E37 | Acronym or abbreviation. Used for quick search. |
| E0070.A0004 | SPACS | Pipeline Reference | [Attribute] | 36CF6F3 | Literature or document describing the pipeline. |
| E0070.A0005 | SPACS | Pipeline Url | [Attribute] | 3CBA1B4 | Knowledge base URL, which provides a preview for the pipeline. |
| E0070.A0006 | SPACS | Pipeline Description | [Attribute] | 1CA63C3 | A brief description for the pipeline. |
| E0070.A0007 | SPACS | Pipeline Metadata | [Attribute] | 28145B2 | Metadata about the pipeline. Can be a serialized json or xml object. |
| E0070.A0008 | SPACS | Pipeline Template | [Attribute] | 3D12598 | A pipeline template that can be populated with actual data input in runtime. The current implementation uses .ipynb (IPython notebook) file as the template format. |
| E0070.A0009 | SPACS | Pipeline Timestamp | [Attribute] | 37FEB58 | Latest revision timestamp. |
| E0068 | SPACS | Log | [Entity] | 36A9EDA | Track the status change in the life cycle of a spectrum data. The ontology defines several phases for the spectrum data life cycle, including generate, preprocess, curate, analyze and report. |
| E0068.A0001 | SPACS | Log Id | [Attribute] | 15E704F | Unique ID. Primary key. |
| E0068.A0002 | SPACS | Operator | [Attribute] | 2C24270 | The operator that causes the status change. Must be one of the valid users in the Account data table. |
| E0068.A0003 | SPACS | Operation | [Attribute] | 316C6BF | Should be one of the following enumerated values. |
| E0068.A0003.V0001 | SPACS | generate | [Value] | 293BBC3 | |
| E0068.A0003.V0002 | SPACS | preprocess | [Value] | 2ED5D4E | |
| E0068.A0003.V0003 | SPACS | curate | [Value] | 3B596BA | |
| E0068.A0003.V0004 | SPACS | analyze | [Value] | 2F90727 | |
| E0068.A0003.V0005 | SPACS | report | [Value] | 3C867BE | |
| E0068.A0004 | SPACS | Device | [Attribute] | 27363F0 | The instrument (e.g. MALDI-TOF-MS or Raman Spectrometer) or client computer where the operation is preformed. Should be the UID in the Device data table. |
| E0068.A0005 | SPACS | Location | [Attribute] | 17273B6 | The institute or laboratory that performs the operation. Can also be a 3rd-party testing organization. |
| E0068.A0006 | SPACS | Message | [Attribute] | 379C7D1 | Any messages or additional data that comes with the operation. |
| E0068.A0007 | SPACS | Spectrum ID | [Attribute] | 10FD80B | A foreign key pointing to the related spectrum object. Spectrum and Log have one-to-many cardinality. |
| E0068.A0008 | SPACS | Log Timestamp | [Attribute] | 166A373 | The creation timestamp of the log entry. |
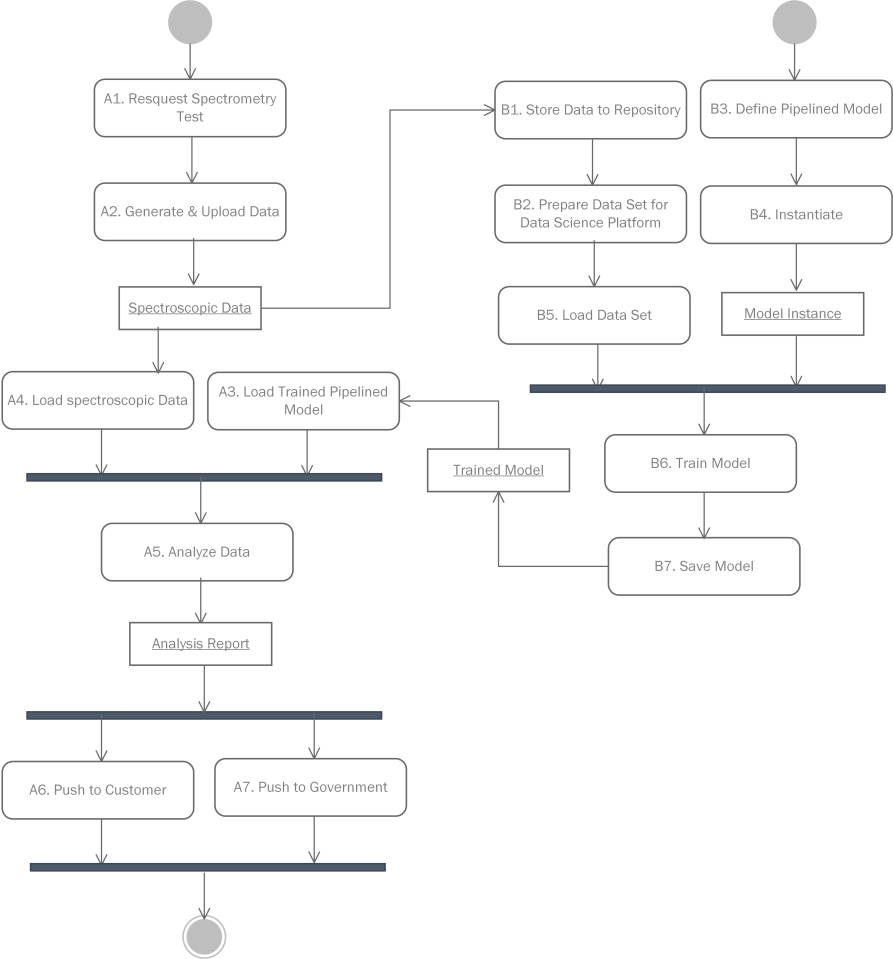
Spectroscopic profiling data processing workflow profile
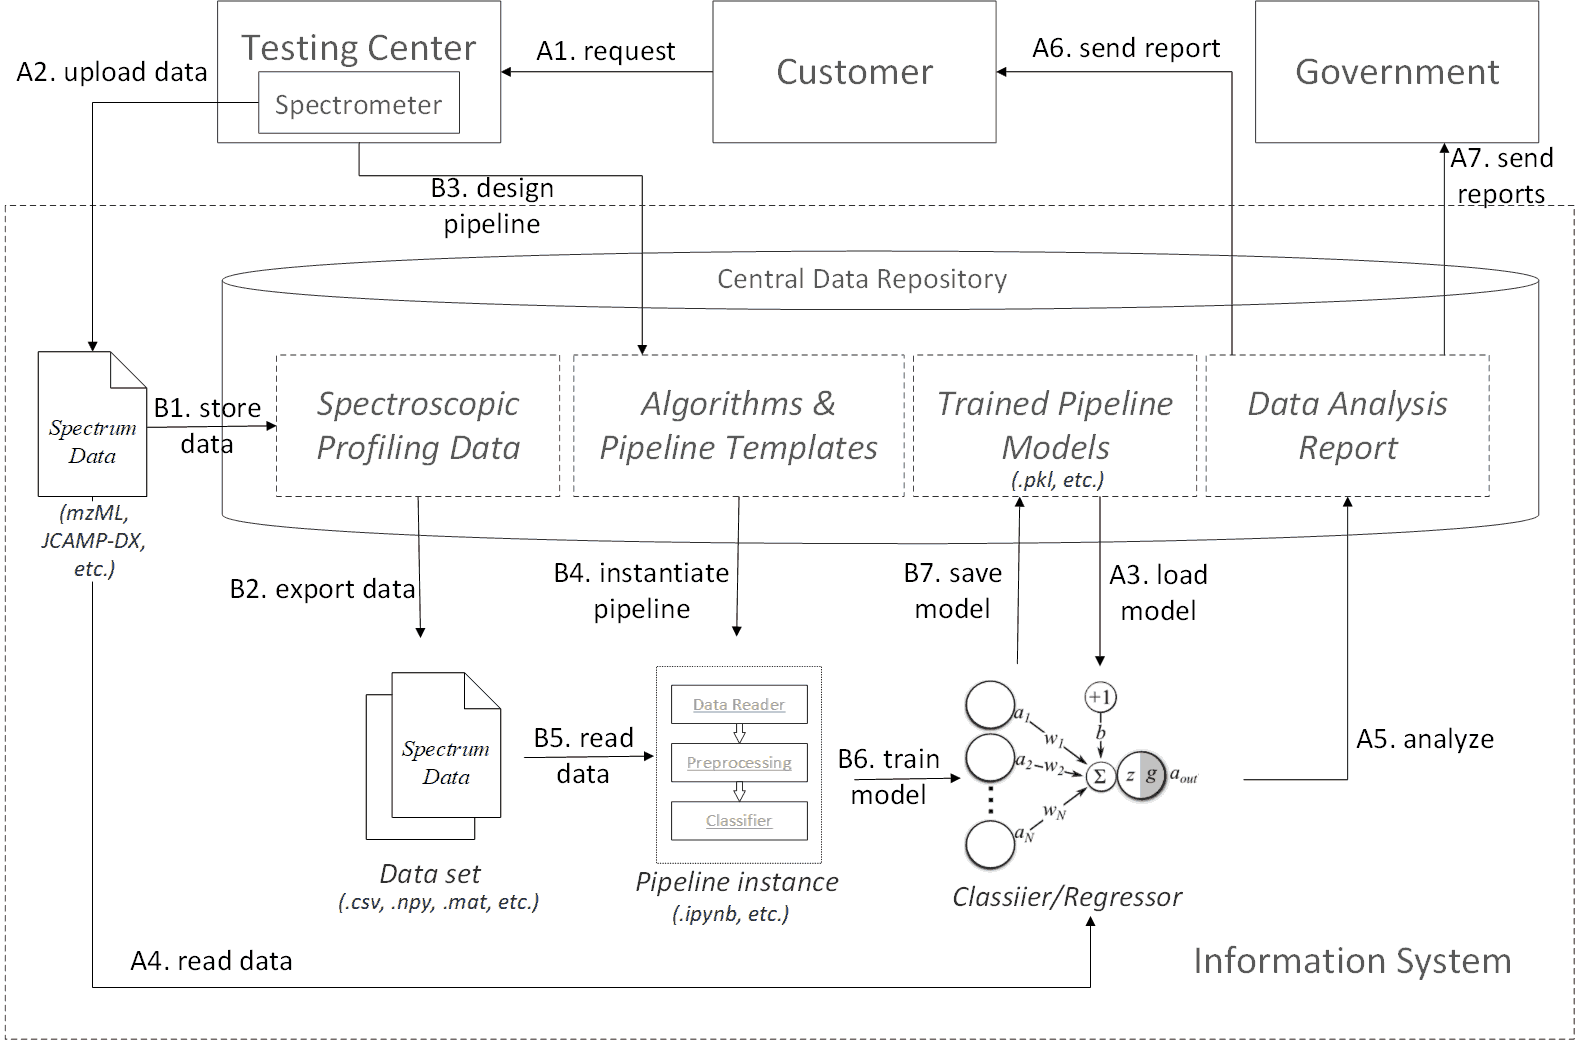
The workflow profile defines two process branches. One is the sample test process, and the other is the model training process. The workflow profile acts as a guideline and should not be restricted to concrete technical implementations. However, in order to better illustrate the profile, we may use specific examples while explaining each procedure.
The sample test process contains the following procedures: A1. The customer sends a test request to a registered testing center or lab. A2. The target sample is preprocessed and tested by a specific spectrometer device. The generated spectrum data is uploaded to the information system in public data formats, e.g. mzML or JCAMP-DX. A3. A corresponding trained model is loaded to the runtime from the central data repository. A4. The spectrum data is read into the model. A5. The data goes through all predefined algorithm procedures in the model to generate an analysis report. A6. The report is sent back to the customer. A7. Periodically or on demand, the analysis reports can be shared by government administrative department as a reference for on-market product quality.
Behind the above sample test process, there is a model training process that continually update the pipeline models. It contains the following procedures: B1. Each spectrum data is first converted to the internal format conforming to the domain ontology. Then the data is stored to the central data repository. B2. The spectrum data are first categorized by the sample type (e.g. formula milk powder or herbs), purpose (e.g. classify milk powder brands or identify a specific genuine geo herb), modality (Raman or MALDI-TOF-MS), and optimally the same preprocessing procedures (i.e. filtering, averaging, peak identification, baseline drift removal, etc.). Then, the data sets are exported to matrix or tabular data format (e.g .csv, .npy, .mat), which are recognizable by most mainstream data science platforms. B3. Algorithm engineers design spectrum data analysis pipeline templates for the target data set. Each algorithm component in the templates is also maintained by the engineers. B4. The template is instantiated in the data analysis runtime. E.g. translated to a .ipynb file for the ipython notebook platform. B5. The data are loaded into the runtime. B6. Algorithm engineers run through the entire training process. Ideally, the instantiated pipeline be interactive, i.e. users can refine and optimized the training scripts or codes on site in a step-wise way. B7. The final model is persisted in the central data repository, which can be reloaded in future sample test processes.
Workflow profile in UML format
Architecture
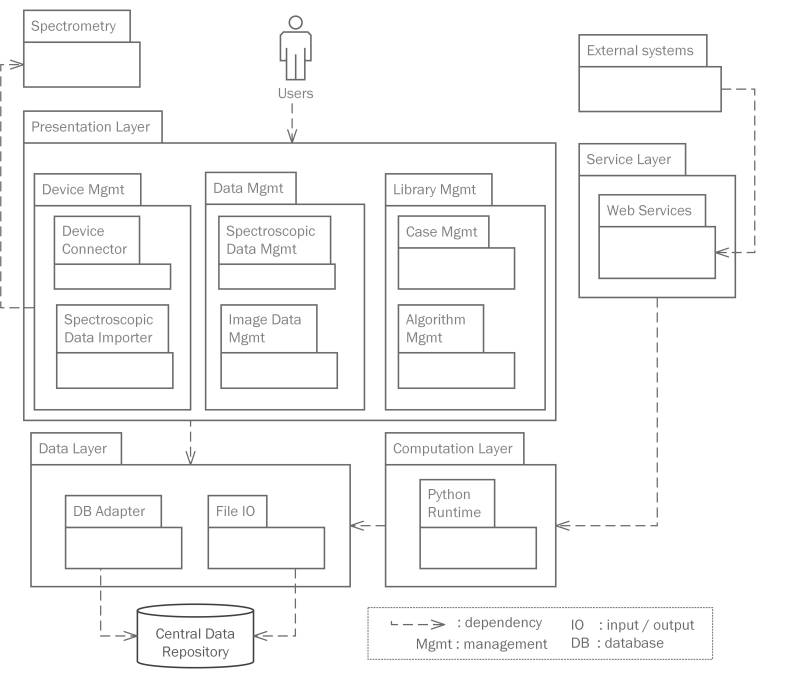
The system contains a presentation layer, a service layer, a computation layer and a data layer. The presentation layer provides GUI (graphical user interface) for users to manage analytical instruments, spectroscopic data, knowledge assets, etc. The service layer defines a set of web service interfaces that enables data exchange and process integration with external systems, such as manufacturer and government systems. The computation layer is a container for a server-side data science runtime, where model training and data analysis are executed. The data layer provides fundamental database and file operations.
| Metric | |
|---|---|
| Operating System | Windows Server 2012 DataCenter 64bit, IIS 7, Microsoft .NET Framework 4.7 |
| Database | SQL Server 2012, SQLite 3.0 |
| Web Server | ASP.Net MVC 4 |
| Web Client | HTML5, CSS 3, Bootstrap 4, jQuery, etc. |
| Programming Language | C#, Javascript, Razor, Python |
| Data Analysis Platform | Python 3.6, sklearn 0.20, Jupyter Notebook 5.7.0 |
| Code Line Count (CLC) | 151,306 |
| Data Volume | 100GB+ |
| Modality | Raman, MALDI TOF MS, Ion Mobility Spectrometry, Single-Photon Ionization TOF, Ultraviolet and visible spectrum, High Performance Liquid Chromatography |
| Test Subject | Dairy, Liquor, Herbs |
| Data Total | 5088 |
| Text Corpus Total (NLP) | 18719 |
| Algorithm Total | 28 |
| Terminology / CV | AgrO (3706), CAS (56341), CDISC (17119), CDNO (1080), CHEBI (55080), EO (562), FOODON (20910), GI (1381), GTIN (1615726), HUGO-PSI MS (2935), KEGG MEDICUS DGROUP (2119), KEGG MEDICUS DISEASE (2206), KEGG MEDICUS DRUG (10564), PO (1734), SPACS (90), Uberon (20350), |
| Project Initiate Date | September, 2017 |
| Iteration | Iteration 5 (Milestone: Spectroscopic Profiling Data Analysis and Reporting) |
2017/09/27
        1. 网站基础框架设计与搭建
        2. 集成Bootstrap,及Bootstrap Dialog、Bootstrap Select等插件,以支持自适应缩放和布局
        3. 集成Font Awesome,支持字符图标
        4. 集成NWebsec,支持W3C的CSP(Content Security Policy)规范,增强网站安全
        5. 集成Elmah日志模块
        6. 集成Glimpse诊断模块
        7. 集成jQuery、jQuery UI、jQuery DataTables、jQuery Mutliselect、jQuery BlockUI、jQuery Form等客户端控件库
        8. 集成SignalR,用于网页客户端与本地服务器的双向通讯
        9. 集成Highcharts,用于数据可视化
2017/10/11
        1. 串口通讯配置和测试页面
        2. 设备监控页面,目前使用模拟数据展现效果
        3. 集成数字转换器SDK,实现基本的从AD卡读取数据的函数
        4. 系统信息页面,显示控制系统的硬件信息,用于查找数字转换器等设备的设备号(SDK调用需要设备号)
        5. 多语言支持,目前支持中、日、英
2017/11/19
        1. 集成SQLite,设计多模态数据的基本存储结构
        2. 谱图数据的保存和加载(浮点数组与数据库二进制blob的相互转换)
        3. 谱图数据的可视化呈现和互操作(缩放、打印、导出)
        4. 谱图数据管理页面,目前导入了46份乳粉拉曼光谱的数据
2017/12/10
        1. 导入620份白酒拉曼光谱的数据
        2. 谱图数据管理首页增加数据库总览视图
        3. 总览视图Drill Down模式
        4. Gnatt图任务管理界面,包括后台数据库读写
Windows Form 设备控制终端
        1. 主控界面
        2. Camera监控窗口
        3. Camera配置对话框
        4. 串口配置对话框
        5. 串口消息发送同步模式(With ACK)
2018/04/28
        1. 导入OvarianCancer-NCI-PBSII-061902 MADLI-TOF数据集
        2. 算法库管理页面
        3. 数据分析流程配置视图
        4. Jupyter Notebook集成
2018/07/07
        1. 导入"黑龙江某乳业公司4种不同奶拉曼光谱"数据集
        2. 导入“甘肃省道地药材离子迁移谱”数据集
        3. 导入“古井贡酒不同年份白酒SPI-MS”数据集
        4. 导入“4种品牌酸奶拉曼光谱”数据集
        5. 导入“五种品牌3段配方奶粉拉曼光谱”数据集
        6. 算法库管理系统软著相关文档
        7. 化学结构3D可视化控件
2018/07/25
1. 导入"黄芪药材不同产地ESI-IMS电喷雾离子迁移谱"数据集
2018/08/26
        1. 增加Log表,与Spectrum建立外键联系
        2. Spectrum对象增加状态追溯界面
        3. 改进:Spectrum谱图可视化依据数据显示横坐标
2018/08/28
        1. 标准库管理页面
        2. 单个谱图数据JSON格式下载
        3. 整个数据集CSV格式下载
        4. 身份认证和登陆功能
2018/09/01
        1. 账号管理页面
        2. 身份认证重构为公共模块
2018/09/05
        1. 扩展Pipeline数据表
        2. 标准库分析页面,提供多种Pipeline配置下的数据分析
        3. Pipeline配置与Jupyter Notebook交互开发和集成测试
2019/03/18
        1. 更新GANTT插件版本
        2. 导入标注术语集FOODON、KEGG、CHEBL等
        3. SiteFlavor
        4. 导入TCM知识库
        5. 导入分子模型
        6. 算法管理页面
2019/04/18
        1. Pipeline模型的训练和测试模板
        2. pkl模型的保存与加载
        3. SPACS CV
        4. 导入HUGO PSI MS术语集
        5. 案例库页面数据可视化
        6. 首页Carousel性能优化(Lazy Load)
        7. 修复缺陷:Concept、Research、Spectrum编辑页面保存丢失部分信息
        8. Boosttrap 3 -> Boostrap 4 (部分页面)
2019/04/18
        1. Pipeline模型的训练和测试模板
        2. pkl模型的保存与加载
        3. SPACS CV
        4. 导入HUGO PSI MS术语集
        5. 案例库页面数据可视化
        6. 首页Carousel性能优化(Lazy Load)
        7. 修复缺陷:Concept、Research、Spectrum编辑页面保存丢失部分信息
        8. Boosttrap 3 -> Boostrap 4 (部分页面)
2019/05/04
        1. 导入PO本体
        2. jstree无法加载缺陷修复:禁用CSP策略(临时方案)
2019/07/14
        1. 导入2019年配方奶粉拉曼数据 T10 & T11:
            CSV:贝因美1线上、贝因美2线上、贝因美3线上、贝因美1线下、贝因美2线下、贝因美3线下、
            爱他美1线上、爱他美2线上、爱他美3线上、爱他美1线下、爱他美2线下、爱他美3线下、
            诺优能1线上、诺优能2线上、诺优能3线上、诺优能1线下、诺优能2线下、诺优能3线下、
            雀巢1线上、雀巢2线上、雀巢3线上、雀巢1线下、雀巢2线下、雀巢3线下
            一共24罐样品,每个样品采集25张拉曼图谱;
            CSV-1:从以上图谱中单独挑出来的(属于脂肪的信息)
          分类标签:
            A-1-OFF LINE 	0
            A-1-ON LINE 	1
            A-2-OFF LINE 	2
            A-2-ON LINE 	3
            A-3-OFF LINE 	4
            A-3-ON LINE 	5
            B-1-OFF LINE 	6
            B-1-ON LINE 	7
            B-2-OFF LINE 	8
            B-2-ON LINE 	9
            B-3-OFF LINE 	10
            B-3-ON LINE 	11
            N-1-OFF LINE 	12
            N-1-ON LINE 	13
            N-2-OFF LINE 	14
            N-2-ON LINE 	15
            N-3-OFF LINE 	16
            N-3-ON LINE 	17
            Q-1-OFF LINE 	18
            Q-1-ON LINE 	19
            Q-2-OFF LINE 	20
            Q-2-ON LINE 	21
            Q-3-OFF LINE 	22
            Q-3-ON LINE 	23
2019/07/31
        1. 导入奶粉MALDI-TOF数据 T12:
            金典纯牛奶 15
            金典低脂纯牛奶 15
            金典有机纯牛奶 15
        2. 添加 GlobalSetting.SpectrumChartSamples 降采样配置选项
        3. /Spectrum/DataView页面显示部分数据以提高性能
2019/11/04
        1. 导入黄芪中药材多模态检测数据T13:
            Raman 4产地x10样本
            IMS 4产地x10样本
            UV 4产地x10样本

        2. 为root组用户在菜单中添加内部研究入口
        3. 期刊管理页面(内部研究用)
        4. SPACS项目主页
        5. 算法管理页面添加代码测试页面
        6. BS3及BS4母版样式同步更新
        7. Web Service对外交互接口设计
2020/02/12
        1. /CS 压缩感知
        2. C#调用原生Python脚本
2020/03/22
        1. 导入三批道地药材HPLC数据集(厚朴、连翘、柴胡)
        2. 数据集导出性能优化
        3. 样本采集、推理和决策管理演示页面:/Spectrum/Inference, /Report;增加Report表
        4. 基于Plotly的数据可视化模块:/V
        5. 图谱解析子视图:/Wiki/Aprior
        6. 压缩感知性能优化:/CS
        7. RAMAN设备控制面板:/Instrument
        8. 首页及主菜单调整
        9. Wechat消息发布支持:/Mobile
        10. 数据时间戳更新:/Spectrum/UpdateTimestamp
        11. Wiki页面UI调整:/Wiki/Ontology,/Wiki/Spectrometry,/TCM
        12. Spectrum类增加用于性能优化的低解析度数组属性:JsonXArrayLD 和 JsonYArrayLD
        13. css全局汉字字体
2020/05/29
        1. 添加页面:/V/Force 力导向图,用于可视化知识图谱
        2. 添加页面:/V/Contour 等高线图
        3. 语义关联页面:/Association
        4. 添加数据库表:AssociationSet
        5. 导入非法添加和易滥用的食品添加剂表"Food_Additives.xls",/Association/Seed
        6. 导入浙江省政府公开数据集(data.zjzwfw.gov.cn)"cata_4370.xls"及"cata_4370_history.xls",/Association/Seed1
        7. 食品安全语料库构建:py/NLP/Web Crawler.ipynb,共导入5,598条文本数据
        8. 语料库管理页面:/Text
        9. 3D地球可视化:/V/Earth,增加projection和scope配置选项
        10. 2D地图可视化:/V/Map
        11. 页面初始化激活特定Tab页:/Home/Spacs/id
        12. 大数据项目成果展示页面:/Research/Bigdata
        13. 知识图谱备用页面原型:/KG
        14. /Wiki/Blockchain
        15. 导入羊奶粉拉曼光谱数据
2020/09/15
        1. 增加requestLimits: maxAllowedContentLength="20000000"
        2. DRMetrics online demo page
        3. Refine CS demo page
        4. 数据采集客户端:System.App.Web.Spectremetry.Client
        5. 迁移串口管理、ADC管理相关模块至 System.App.Web.Spectremetry.Client
        6. /SeedFake: 模拟数据生成,数据集代号F开头
        7. Add links (/V/force and /Association/Index) on page /Text/Index
        8. 导入数据集GTIN
        9. 词云可视化 /V/WordCloud
        10. 添加cross site API:/Spectrum/Inference and /Spectrum/Upload。供Client调用
2020/10/24
        1. 导入食盐EDS和Raman数据集(T19、T20)
        2. MailSender支持HTML
        3. 导入拉曼数据集R20
        4. 数据集下载功能:邮件验证码
2021/01/19
        1. Fix PermissionError (call py from C#): [Errno 13] Permission denied: 'c:\\...\\PKG-INFO'
           Solution: Elevate IIS application pool account privellege, e.g., change to a system admin account.
        2. 定制RoleManager
        3. 根据访问地址动态调整Site Flavor. If the website is accessed via xxx.host, use its specific homepage.
        4. New version of pyDRMetrics
        5. /Research/DR for dimensionality reduction quality assessment
        6. /Research/LR for credit scoring
2021/02/10
        1. Improve Home Page; Add More Knowledge Cards to the Carousel.
        2. Add links to /Research/Bigdata5:供应商征信评级、中药材价格指数
        3. 导入数据集“婴幼儿米糊(Rice Cereal)拉曼光谱”
        4. 导入术语集“地理标志产品 GI”
2021/06/13
        1. 导入数据集“连翘(forsythia)不同产地电子鼻数据”
        2. 支持电子鼻数据类型(多channel、时间序列)
        3. 数据集可分性度量。wCLAMs:a wrapper for pyCLAMs
        4. Experiment扩展Preview(二维可视化预览)和Image字段
2022/01/01
        1. 导入数据集“连翘(forsythia)不同产地电子舌数据(降采样后)”
        2. 支持电子舌数据类型(多channel、时间序列)
        3. 导入数据集“奶粉基粉不同产地电子舌数据(降采样后)”
        4. Spectrum扩展YAxisMeaning字段
        5. 2021新增成果更新
        6. 导入术语集AGRO,CDISC,CAS,CDNO,UBERON
        7. 道地药材一览/TCM/Daodi
2022/07/01
        1. 导入食盐拉曼光谱数据集
        2. 导入川贝母、浙贝母拉曼光谱
        3. 导入不同产地铁皮石斛拉曼光谱
        4. 导入野生及种植黄精根切片拉曼光谱
        5. 导入柴胡不同品种及产地拉曼光谱
        6. 导入红杆绿杆黄精拉曼光谱
        7. bootstrap类样式优化,支持移动端自适应布局
        8. 数据集页面增加首个数据的预览图
        9. pdfjs,支持移动端webview显示pdf
        10. jquery datatable 多语言支持
        11. 重新导入完整的连翘(forsythia)不同产地电子舌数据
2023/03/25
        1. ICP可配置
        2. 更新/Research/Bigdata相关成果