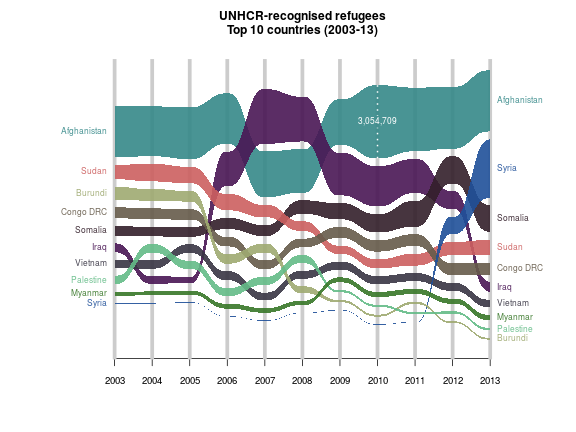
Alluvial diagram 冲积(扇)图
Alluvial diagrams were originally developed to visualize structural change in large complex networks. They can be used to visualize any type of change in group composition between states or over time and include statistical information to reveal significant change. Alluvial diagrams highlight important structural changes that can be further emphasized by color, and make identification of major transitions easy.
a.k.a., Parallel Categories Diagram
The parallel categories diagram is a visualization of multi-dimensional categorical data sets. Each variable in the data set is represented by a column of rectangles, where each rectangle corresponds to a discrete value taken on by that variable. The relative heights of the rectangles reflect the relative frequency of occurrence of the corresponding value.